retainers

AFAs accounted for less than 10% of all matters in the US last year

This month saw publication of the End-of-Year 2015 edition of the Enterprise Legal Management Trends Report by LexisNexis and CounselLink.

Based on data derived from outside counsel invoices – accounting for US$21 billion in legal spend in the USA – processed through the CounselLink platform, to my mind what makes this Report different to others is this: it provides insights others might miss because while talk can be cheap, the numbers rarely lie.

i2

[click on image to enlarge]

From an Australian perspective, a couple of surprising statistics come out of this year’s Report.

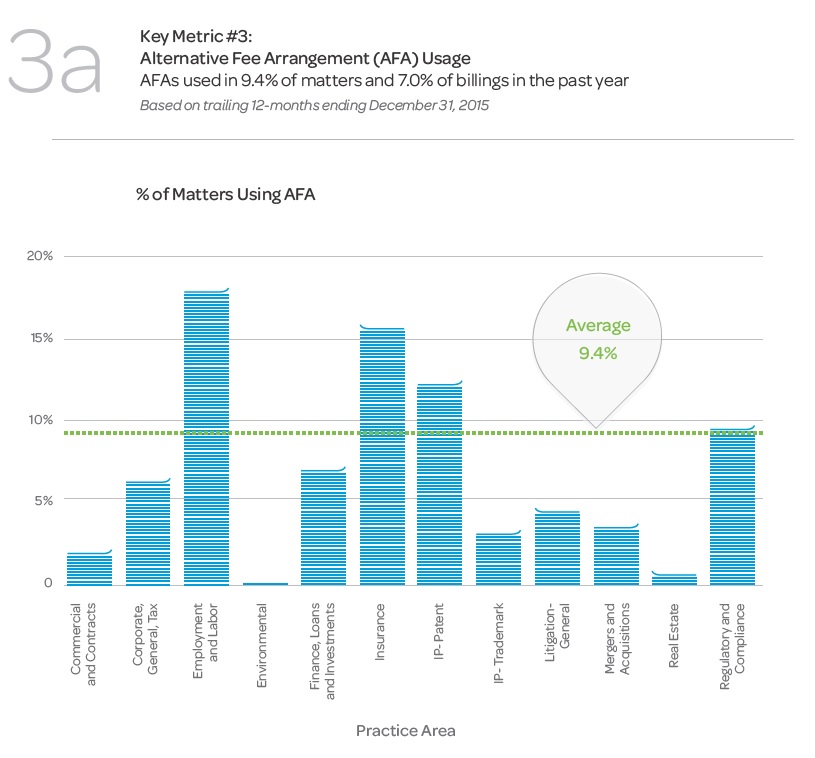
  • the use of AFAs, to govern the service payment of matters, only accounted for 9.4% of matters processed through the CounselLink platform. Given all the chatter and whining you hear from law firms, I would have expected this rate to be much, much higher.
  • Employment and Labor (at 17.3%) is a fairly significant practice area leader in the number of matters (but not revenue – see below) using AFAs, but Real Estate accounting for something less than 2% of its practice area matters using AFAs seems out of whack.
  • Nearly 10% of Regulatory and Compliance matters are done under AFA arrangements. At first this seemed a little strange (given the grey hair nature of the advice being sought), but then I thought a large number of compliance programs could be sold using retainers, fixed fees and other AFAs.

i3

[click on image to enlarge]

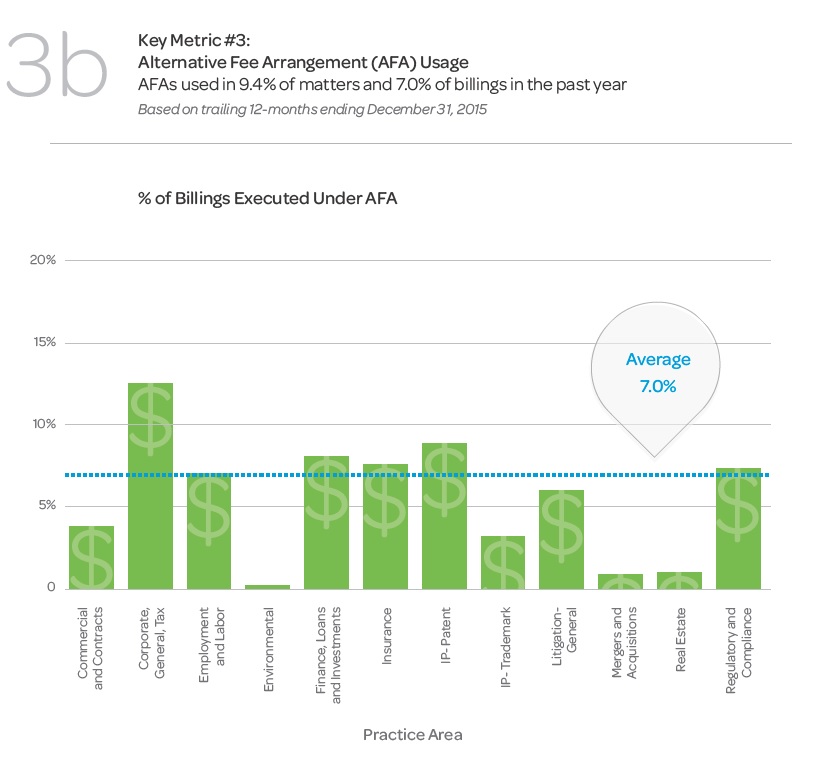
Moving on to percentage of “billings” executed under AFAs and things start to get really interesting.

  • at 12.4%, by far the biggest practice area using AFAs by billings is Corporate, General and Tax (excluding Mergers and Acquisitions, which is a separate line entry). Not sure I would have guessed that.
  • Finance, Loans and Investments ranked third highest practice area using AFAs by billings last year. Again, don’t think I would have picked that.
  • by billings, only 7% of Employment and Labor practice area matters are executed under AFAs. So, 17.3% of Employment and Labor matters were conducted under AFAs, but only 7% of billings. Might just be me, but that seems strange and I’d want to dig deeper into why that might be the case if my practice was showing these numbers. Then again, may just be the Pareto Theory in practice!
  • At roughly 2% of practice area billings, who says Real Estate has become a commoditized practice area? Because these numbers aren’t showing it.

Interesting numbers showing through this Report. Lots of chatter around the rise in M&A activity/revenue and the fact that “New Law” isn’t being hired to do big ticket work, but the use of AFAs and rationalization of legal panels (which I may well blog on later this week) were my two big takeouts.

RWS_01

Almost 20% of Australian law firms revenue is now coming from fixed fees

dreamstime_m_34802664

It has been a full six months since the last CommBank Legal Market Pulse (conducted by Beaton Research + Consulting) was published and from what I can tell from this latest publication, not very much has changed in that time.

While some members of the Australian legal publishing world have commented on the rising optimism (note this is “perception”, and this has gone from awful to not quite so awful), what grabbed my attention was a piece towards the end of the report (page 19) that states:

“Revenue is still predominantly derived from hourly rates. However, almost 20% of all firms revenue, irrespective of size, is now coming from fixed fees.”

I don’t have to hand data from 5 years ago that would allow me to do a comparison to see what this means in real terms, but given that IBISWorld puts the size of the Australian legal market at $23BN, that’s a lot of fixed fee generated revenue.

Somewhat surprisingly, there doesn’t appear to be a huge difference in the percentage of fixed fee revenue being derived at “top-tier” and “mid-tier” firms – with fixed fees accounting for 19.4% of revenue at top-tier firms and 19.2% among mid-tier firms.

The types of work for which fixed fees are being agreed/charged is also very similar – 88% for transactional matters at top-tier and 89% at mid-tier.

Notable, and surprisingly, is that top-tier firms would appear to be much more willing than mid-tier firms to offer fixed fees for litigation work – 50% to 33%.

But the test is always in the tasting (for wine lovers at least): so how good are Australian law firms at fixed fee pricing?

Well, not very if the data is to be believed. Asked for the margin on fixed fees relative to hourly rates, the responses were:

  • higher: 13% top-tier / 15% mid-tier;
  • lower: 0% top-tier (which seems a little hard to believe) / 56% mid-tier (which is probably being too honest)
  • about the same: 75% top-tier / 19% mid-tier; and
  • not sure: 13% top-tier / 11% mid-tier (which should be worrying some managing partners out there).

As well as finding out that Australian law firms are not very good at fixing fees, the report also tells us that over 67% of all law firm revenue still comes from standard hourly rates or discounted hourly rates. Here though, over 25% of revenue comes from “discounted” hourly rates – which begs the question: when do you start saying your discounted rates are your real rates?

Lastly, almost 3% of all law firm revenue now comes from retainer arrangements (2.6% for top-tier, 2.8% for mid-tier). Now that’s certainly something worth keeping an eye on!